Excellent software and practical tutorials
collectd System statistics collection daemon
collectd is aDaemon, which periodically collects system and application performance metrics and provides mechanisms to store the values in a variety of ways, such as in RRDdocumentmiddle.
collectd collects metrics from various sources, such as the operating system, applications, log files, and external devices, and stores this information or makes it available on the network. These statistics can be used to monitor the system, discover performance bottlenecks (i.e. performance analysis), and predict future system load (i.e. capacity planning). Or, if you just want nice graphs for your private server and have had enough of some homegrown solutions, you've come to the right place too!
What is collectd
collectd is a daemon process that periodically collects system and application performance metrics and provides mechanisms for storing these metric values in different ways.
collectd collects metrics from various sources, such as the operating system, applications, log files, and external devices, and stores this information or makes it available over the network. These statistics can be used to monitor the system, find performance bottlenecks (i.e. performance analysis) and predict future system load (i.e. capacity planning), among other things.
- It is written entirely in C language, so it has high performance and good portability, allowing it to run on systems that do not have scripting language support or cron daemon, such as embedded systems. At the same time, it contains new features for optimizing and processing hundreds of data sets.
- collectd contains more than 100 plugins. At the same time, collectd provides powerful network features and can be expanded in many ways.
collectd official website:https://collectd.org/
collectd wiki address:https://collectd.org/wiki/index.php/Main_Page
How to Install collectd
wget https://storage.googleapis.com/collectd-tarballs/collectd-5.12.0.tar.bz2 tar xf collectd-5.12.0.tar.bz2 cd collectd-5.12.0 ./configure make all install
You can also add some other optional options at the end, such as:
--prefix=/usr --sysconfdir=/etc -localstatedir=/var --libdir=/usr/lib --mandir=/usr/share/man --enable-all-plugins make all install
Or directly execute the command to install:
dnf install collectd
- Configuration file directory: /etc/collectd/collectd.conf
- Startup file directory: /etc/init.d/collectd
- Log file directory: /var/log/syslog
- Data storage directory: /var/lib/collectd/rrd/
How to configure collectd
vim /opt/collectd/etc/collectd.conf
Enable the corresponding plug-in for whatever system items need to be monitored, generally including cpu, memory, processes, load, interface, disk, swap, etc.
Generally, you only need to modify the network plugin:
Network plugins can send data to a remote instance of collectd (e.g. a database, csv file, or cache), or receive data from a remote server.
LoadPlugin network # Remove # to load the plugin# # client setup: Server "10.24.106.1" "25826" # The address and port are the address and port of the server that receives data, for example: the address and port of the server where the database (influxdb, etc.) is installed # # If you need to transmit encrypted data, configure this small part # SecurityLevel Encrypt # Username "user" # Password "secret" # Interface "eth0" # ResolveInterval 14400 # # TimeToLive 128 # # # server setup: # Listen "ff18::efc0:4a42" "25826" # If this part is configured, it means receiving data sent from other collectd instances ## SecurityLevel Sign # AuthFile "/etc/collectd/passwd" # Interface "eth0" # # MaxPacketSize 1452 # # # proxy setup (client and server as above): # Forward true # # # statistics about the network plugin itself # ReportStats false # # # "garbage collection" # CacheFlush 1800
How to Start collectd
Execute Command sudo /etc/init.d/collectd start
or systemctl start collectd And set the boot systemctl enable collectd
How to view collectd data
If the rrdtool plugin is enabled, you can /var/lib/collectd/rrd/ See the corresponding statistics under the directory.
You can view specific data by using the following command:
rrdtool fetch *.rrd AVERAGE
*.rrd means any file ending with .rrd. You can search Baidu for more detailed usage of rrdtool command.
You can see that the first column is timestamp. You can use the command date -d @timestamp to convert the timestamp (in seconds) to the same time format as displayed by the date command. The command date +%s represents the time in the form of a timestamp.
Introduction to collectd related plug-ins
Plugin: CPU
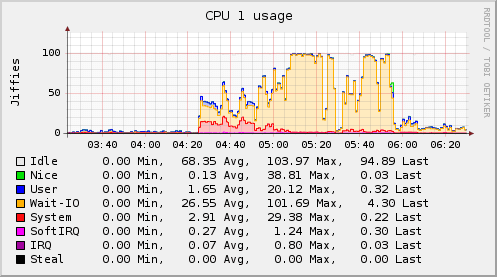
- jiffies: is a unit. jiffies is a global variable in the kernel that records the number of ticks generated since the system was started. In Linux, a tick can be roughly understood as the minimum time unit for operating system process scheduling. Different Linux kernels may have different values, usually between 1ms and 10ms.
- user: The running time in user mode from system startup to the current time, excluding processes with negative nice values.
- nice: The CPU time occupied by processes with negative nice values from system startup to the current moment.
- idle: The waiting time other than I/O waiting time accumulated from system startup to the current time.
- wait-io: I/O operation waiting time accumulated from system startup to the current time.
- system: The running time in kernel state accumulated from system startup to the current time.
- softIRQ: Soft interrupt time accumulated from system startup to the current moment.
- IRQ: Hard interrupt time accumulated from system startup to the current moment.
- Steal: Time spent running other operating systems in a virtual environment.
Plugin: interface
The Interface plugin collects information about traffic (octets per second), packets per second, and interface errors (in one second).
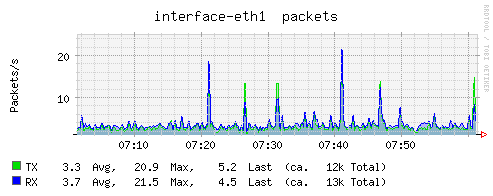
- rxpck/s: packets received per second
- txpck/s: data packets sent per second
- rxbyt/s: the number of bytes received per second
- txbyt/s: the number of bytes sent per second
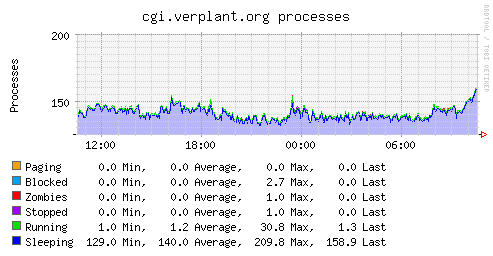
Plugin: processes
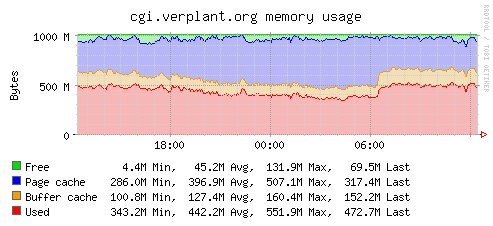
Plugin: memory
Collects the system's physical memory utilization
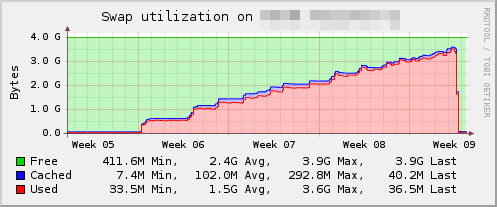
Plugin: swap
Collect swap space usage
In Linux, system-related data can be obtained through the command cd /proc/ Look in this directory.


