Excellent software and practical tutorials
What is Flush
Flush It is a securities decision-making system in mainland China, developed by Zhejiang Hexin Tonghuashun Network Information Co., Ltd., a company listed on the Shenzhen Stock Exchange. The predecessor of Zhejiang Hexin Tonghuashun was Shanghai Hexin Software Technology Co., Ltd., which was established in 2001. On February 13, 2007, the company acquired the equity of Hangzhou Hexin 100%, moved to Hangzhou, and changed its name to Zhejiang Hexin Tonghuashun Network Information Co., Ltd.
Founded in 1995, Hexin Tonghuashun Network Information Co., Ltd. (Tonghuashun) is a professional InternetfinanceData service provider, providing you with comprehensive financial information and global financial market trends, coveringstock, funds, futures, foreign exchange, bonds, banks, gold and other services for individuals and enterprises.
Tonghuashun official website:https://www.10jqka.com.cn/
Flush Download
Download the free version of Tonghuashun:https://activity.ths123.com/acmake/cache/1361.html
Download the Flush Far Eastern Edition:http://activity.ths123.com/html/xb/160809/index.html
Download the MAC version of Tonghuashun:http://product.10jqka.com.cn/mac/index.html
Download the mobile version of Tonghuashun:http://mobile.10jqka.com.cn/
Detailed explanation of the update content of Tonghuashun Yuanhang version 8.7
- 【New】Main chart indicator overlay
- [Optimization] The analysis chart on the right side of the quotation table supports dragging
- [Optimization] Smart line drawing
- [Optimization] Add or delete sector stocks in the right-click menu
- [Optimization] L2-Queue Details
1. [New] Main chart indicator overlay
The K-line main chart can overlay multiple indicators at the same time
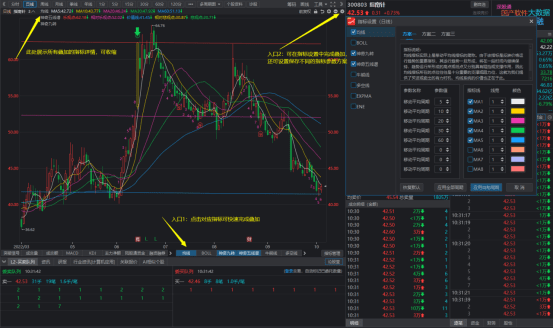
Function entry: 1. Indicator bar below the K-line main chart; 2. "Indicator Settings" in the upper right corner of the main chart
- Click any K-line main chart indicator to complete the overlay, and click again to cancel the overlay;
- Click Settings in the upper right corner to complete the overlay in the indicator settings window, and you can also modify the indicator parameters;
- The indicator details can be collapsed and expanded above the K-line main chart.
2. [Optimization] The analysis chart on the right side of the quotation table supports dragging
The width of the analysis chart can be adjusted as needed
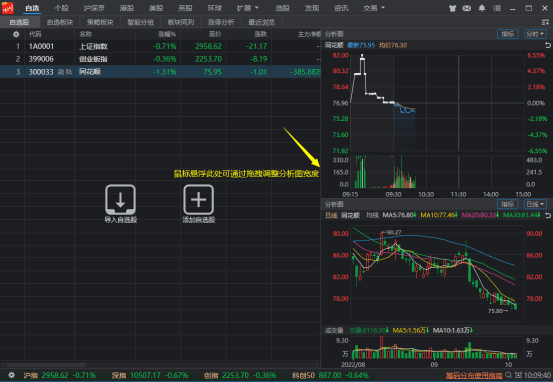
Function entry: Analysis chart on the right side of the quotation table
- The width of the analysis chart can be adjusted by dragging;
- When the width is reduced to a certain extent, the coordinate axis will adapt to the inside of the analysis chart.
3. [Optimization] Smart line drawing
Added intelligent line drawing for support and pressure lines (shortcut key 70) and golden section lines (shortcut key 71)
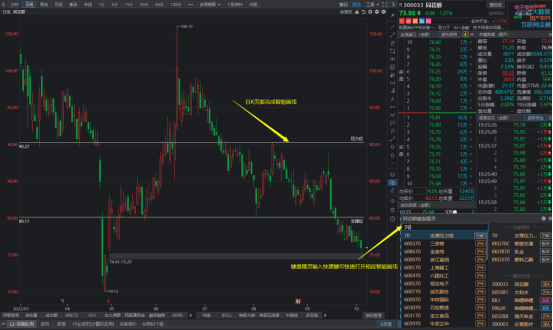
Function entry: Keyboard Wizard enters the corresponding shortcut key for Smart Line Drawing
- Input 70 in the keyboard wizard and press Enter to intelligently draw the support and pressure lines;
- Input 71 in the keyboard wizard, and press Enter to draw the golden section line intelligently;
- Currently only the daily K interface is supported.
4. [Optimization] Add or delete sector stocks in the right-click menu
You can quickly add and delete optional sections
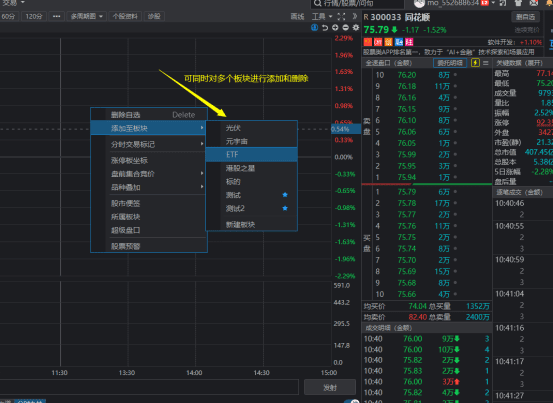
Function entry: right-click menu-add to section
- The sector where the individual stocks are located is marked with a star, which is clear at a glance;
- Multiple sections can be added and deleted quickly.
5. [Optimization] L2-Order queue details
The full price of the queue is displayed, and the complete quotation shows the entrustment mark
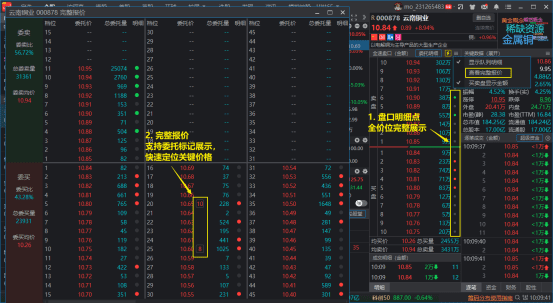
(Level 2 privilege) Full display of all prices and queue details:
- Entry 1: After checking "Show queue details", click the queue details point to support full price display
- Entry 2: Market Menu - View the complete quote, which supports displaying the entrustment mark and can quickly locate the key price of the entrustment (dragging is not supported yet).

